We strongly encourage users to use Package manager for sharing their code on Libstock website, because it boosts your efficiency and leaves the end user with no room for error. [more info]

Rating:
Author: dany
Last Updated: 2020-03-13
Package Version: 1.0.2.1
Category: Other Codes
Downloaded: 1002 times
Not followed.
License: MIT license
Shows the function calls of the project in a number of views (a.o. graphical tree).
For mP, mC and mB for PIC and dsPIC.
Do you want to subscribe in order to receive notifications regarding "Tool: Function Calls Display" changes.
Do you want to unsubscribe in order to stop receiving notifications regarding "Tool: Function Calls Display" changes.
Do you want to report abuse regarding "Tool: Function Calls Display".
| DOWNLOAD LINK | RELATED COMPILER | CONTAINS |
|---|---|---|
| 1584130209_tool__function_c_other_other.zip [288.42KB] | Other Compiler |
|
For mP, mC and mB for PIC and dsPIC.
* Shows the function calls (1 level deep) of the project in a number of views:
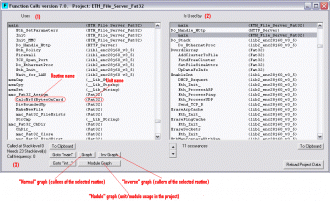
- which functions use which other functions (-1- left main window)
- which functions are used by other functions (-2- right main window)
* Additionally the following info is given:
- the (deepest) stack call level, the needed stack depth and the call frequency of a function (3)
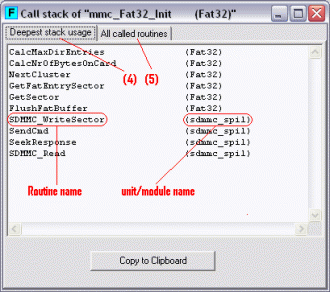
- the deeptest call stack (the names of its subsequent called functions) of a function (4)
- the full call stack (the names of its subsequent called functions) of a function (5)
(1), (2) and (3): see ScreenShot
(4) and (5): see ScreenShot
- Selecting a function in one view shows all its occurences in the other view.
- Double clicking a function goes "down" in the call stack in the "uses" view, and "up" in the call stack in the "is used by" view.
- Right clicking a function shows its call stacks in a separate screen.
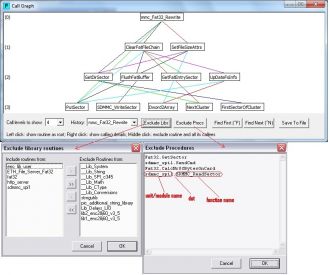
* The call tree of the last selected function in one of both main windows can be shown graphically (and saved to a file).
* The call depth shown can be limited in the graphical view. One can click one of the procedures on the screen to see its caller tree, and go to previous procedures selected via the history. Single functions (and their callees) or all functions from specific libraries can be ingored in the graphicall call tree.
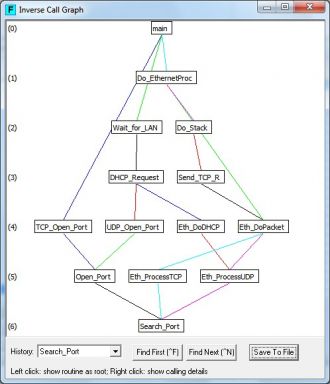
* The inverse graphical tree (which routines do call the selected one) is also provided.
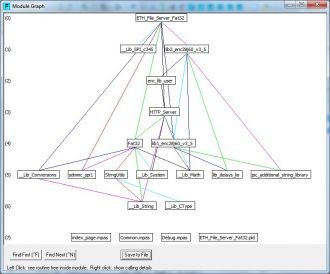
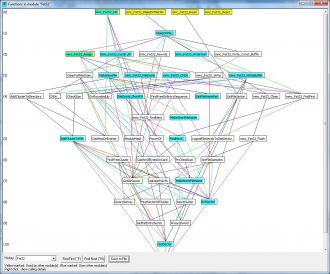
* The Project's Module tree (which modules/units use other modules/units) and a
Module's Routine tree (the call graph of all routines inside a module/unit) are also present.
Keep in mind that all info that you see is that of the current project. This means e.g. that unused procedures are not shown!
So: always compile the project before tool usage, the tool needs the listfile and the callertable.
The tool is to be started up from within the IDE, it can not be used stand alone.

------------------------------------------------------------------------------------------------------------------------------------------
Version 10.2: Problems with finding PIC32 interrupt routines solved.
------------------------------------------------------------------------------------------------------------------------------------------
Version 10.4: Problem for P18 solved.
Version 11.0: Also '*.inc' files including code are recognised now.